Regenerative Microclimate Scorecard, Cork
A larger Cork City study area centred on Nano Nagle Place (home of the Cork Centre for Architectural Education) on Douglas Street. The same workflow as the Marseille demo runs three microclimate analyses over the block and compares a baseline against a tree-canopy intervention.
Workflow
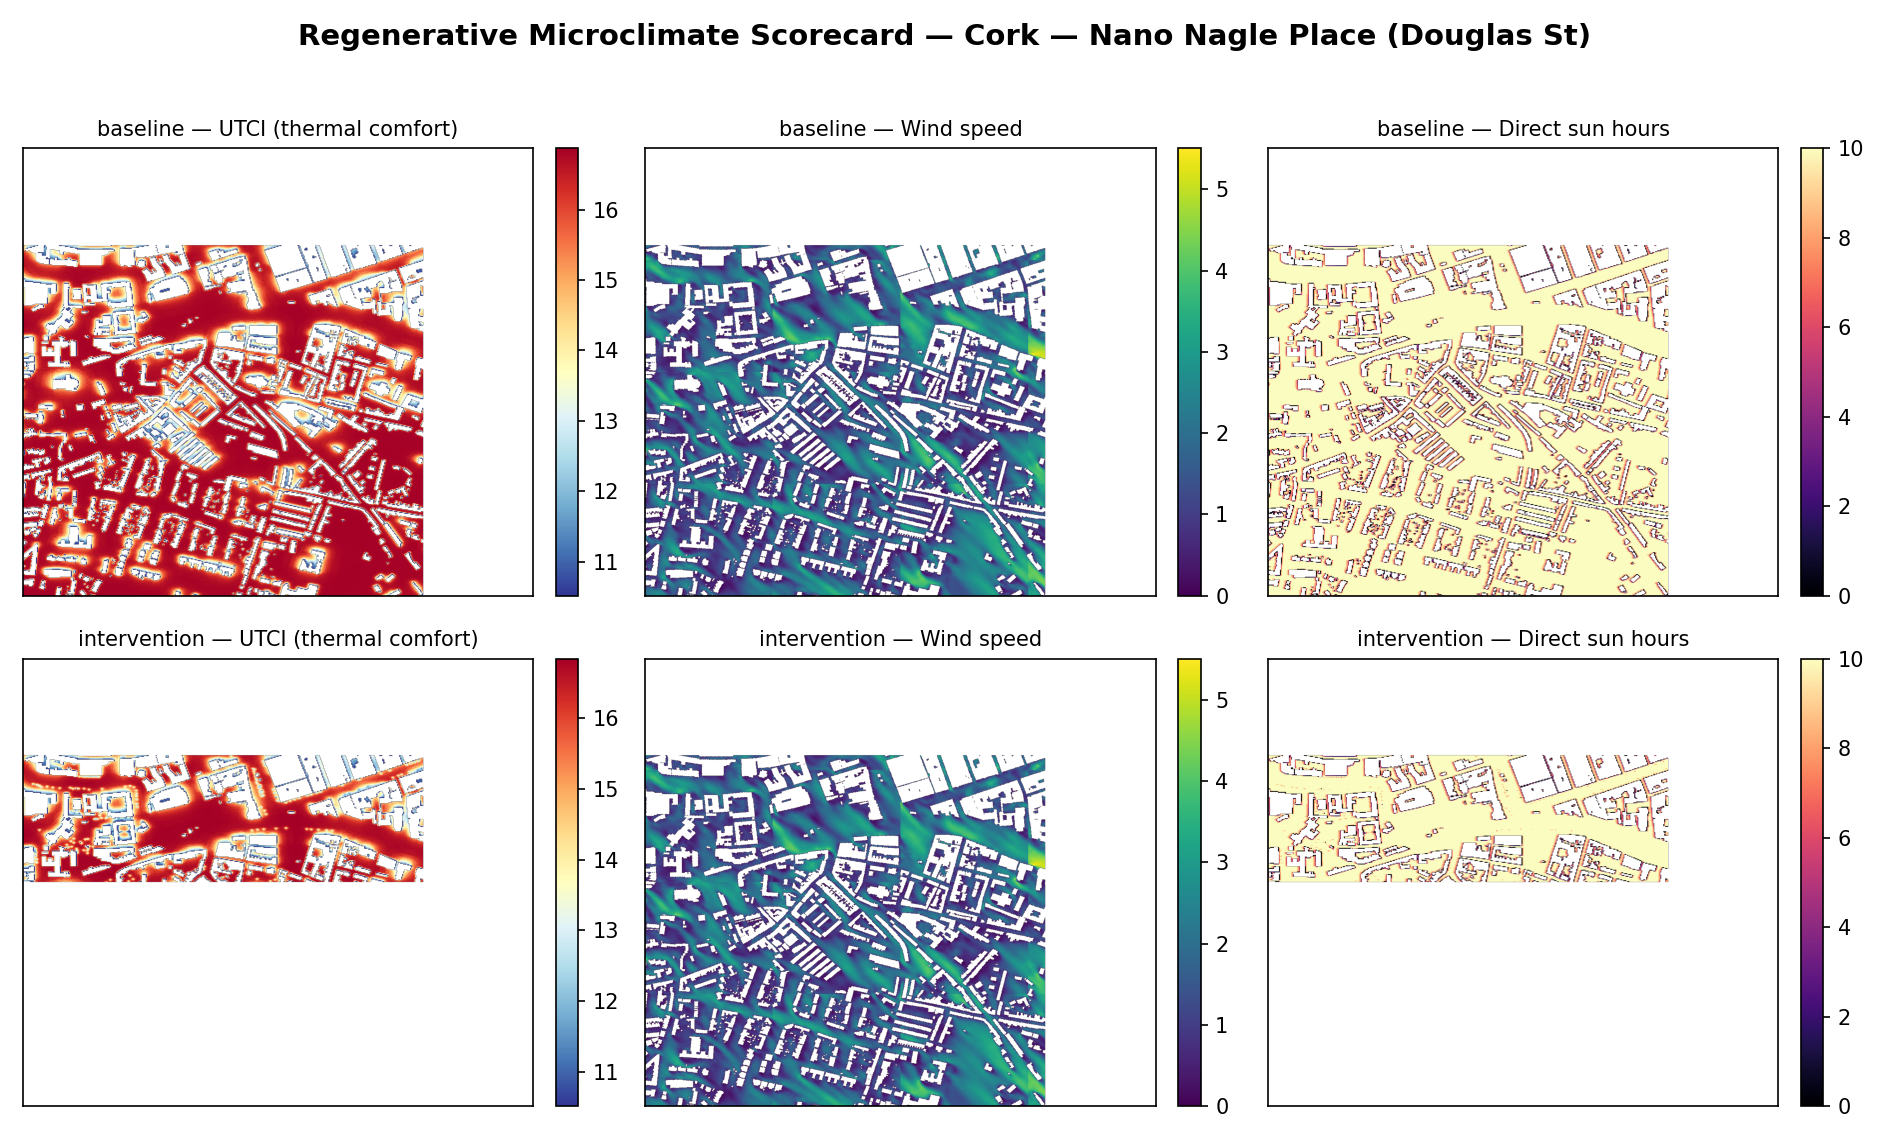
Thermal comfort (UTCI)
| Metric | Baseline | + Trees | Change |
|---|---|---|---|
| Mean UTCI | 15.6°C | 15.2°C | −0.4°C cooler |
| Comfortable area (9,26°C) | 100% | 100% | no change |
| Heat-stress area (UTCI>26°C) | 0% | 0% | 0 (mild climate) |
| Thermal-zone diversity (Shannon) | 1.18 | 1.27 | +7.6% |
Cork's maritime climate is already fully comfortable in the August window, so there is no heat stress to relieve, the regenerative signal shows up elsewhere: adding the 2,787-tree canopy cools mean UTCI by 0.4 °C and raises thermal-zone diversity (+7.6%), creating more varied microclimate niches. Wind speed was unchanged by the canopy at this resolution, and the canopy shaded enough cells to lower direct-sun-hours coverage, a visible shading effect rather than a comfort one. This is the instructive contrast with Marseille, where the same workflow targets heat-stress reduction.
Method
One run_area_and_wait() call per analysis over the Cork polygon. Buildings and weather
are injected for all runs (thermal-comfort requires geometry); vegetation is injected only for the
intervention. Outputs are merged NumPy grids scored by regenerative_metrics.py
(UTCI bands, heat-stress %, Alberti assembly index). Weather is drawn from the nearest EPW station to Cork.